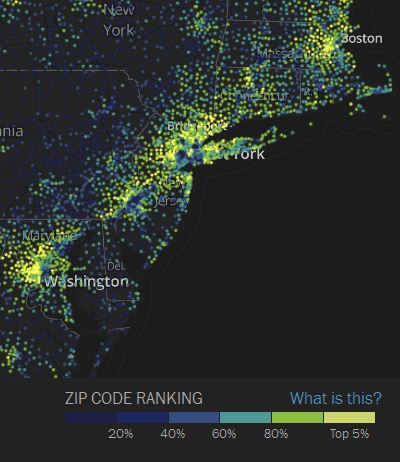
In this map, all Zip codes with more than 500 people are ranked from 0 to 99 based on household income and education. The ‘Super Zips’ rank 95 or higher. The map at the top shows the highest concentration of the nation’s 650 Super Zips. The typical household income in a Super Zip is $120,272, and 68 percent of adults hold college degrees. That compares with $53,962 and 27 percent in the other zips mapped. Washington D.C. shows a powerful bifurcation: One-third of Zip codes in the D.C. area are considered ‘Super Zips’ for wealth and education and large swaths of the metropolitan area are considered food deserts.
This weekend I had the privilege essentially flying from Boston to Washington DC at night and was mesmerized by the vast urban expanse beneath me. It was the greatest concentration of wealth in the United States as well as the some of the most blighted regions of the country. What explains the spatial patterns of highly concentrated wealth and poverty in the biggest cities? Are cities a causal factor in wealth and poverty creation? What does this zip code data tell us? What accounts for the spatial patterns in your region?
Tags: Washington DC, urban, unit 7 cities.housing, economic, poverty, place, socioeconomic, neighborhood.
See on www.washingtonpost.com


Leave a comment