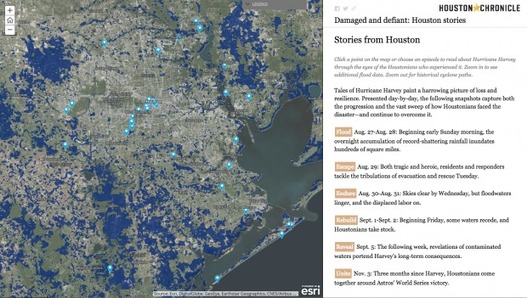
“Blue and her team selected 45 stories, each plotted with ESRI’s ArcGIS software on a map of Greater Houston and tied to the exact location where it was first told. The resulting story map of Hurricane Harvey, ‘Damaged and Defiant: Houston Stories,’ was published in the Houston Chronicle in December. The map shows short narratives gathered by Chronicle staffers from people across the area — from Crosby to Kingwood to Katy — each a unique perspective on the storm; told together, they’re the collective account of a city that experienced one of the worst natural disasters in U.S. history.”
Source: news.rice.edu
These interlinked Houston story maps show some of the key elements of a good story map: 1) strong spatial analytical components, 2) a powerful narrative, 3) rich visuals, 4) solid cartography, and 5) well-sourced information.
Tags: fluvial, water, coastal, urban, disasters, physical, mapping, ESRI, StoryMap.


Leave a comment