Search

GEOGRAPHY EDUCATION

Supporting geography educators everywhere with current digital resources.

Author

sethdixon

I am a geography professor at Rhode Island College.

California’s biggest dam removal project in history begins in Carmel Valley

In a project that will be watched by engineers and biologists across the nation, construction crews today will begin a three-year, $84 million project to tear down the hulking San Clemente Dam in Californias largest dam-removal project ever.

See on www.mercurynews.com

Map The iPhone Users In Any City, And You Know Where The Rich Live – Business Insider

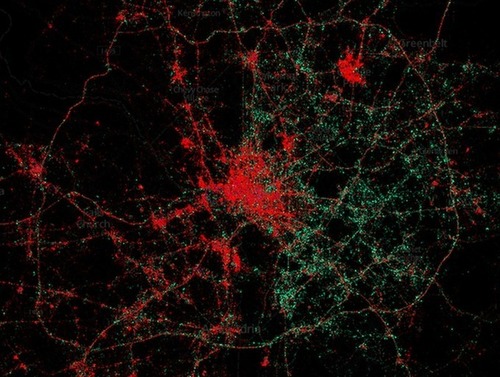
“Our stuff often says a lot about us, whether we own a hybrid car or a station wagon, a MacBook Pro or an ancient desktop.  Among other things, cell phone brands say something about socio-economics – it takes a lot of money to buy a new iPhone 5 (and even more money to keep up with the latest models that come out faster than plan upgrades do). Consider, then, this map of Washington, D.C., which uses geolocated tweets, and the cell phone metadata attached to them, to illustrate who in town is using iPhones (red dots) and who’s using Androids (green dots).”

See on www.businessinsider.com

Esri Thematic Atlas

The Esri Thematic Atlas is a configurable web application that uses a collection of intelligent web maps with text, graphics, and images to talk about our world.

Seth Dixon‘s insight:

ESRI is moving towards creating a dynamic, authorative, living digital atlas; and empowering users to create their own.  StoryMaps are also democratizing the mapping process.  Explore these excellent examples of storymaps (Endangered Languages and top 10 physical landforms). 

Tags: GIS, ESRI, mapping, cartography, geospatial, edtech.

See on atlas.esri.com

Gapminder

” Unveiling the beauty of statistics for a fact based world view.”

Seth Dixon‘s insight:

I know that many of you have seen Gapminder, but for those that haven’t, this is one of the best ways to visualize global statistics.  The world is changing–see how. 

Tags: visualization, statistics.

See on www.gapminder.org

Freedom of the Press Index for 2013

“Reporters Without Borders recently published Press Freedom Index for 2013 takes into account many issues of journalistic liberty, ranging from restrictive legislation to violence against journalists.  The More It Changes, The More It Stays the Same.”

Seth Dixon‘s insight:

What leads to a free press? Political factors and the presence a strong, stable democracy are obviously the key factors.  However, as this article highlights, cultural and developmental issues also influence the geography of freedom of the press.

See on geocurrents.info

Mapping Your Trips

“The following pictures are all embedded in this ArcGIS Online map that I created as a part of the T3G institute in Redlands CA on the ESRI campus.”

Seth Dixon‘s insight:

For me exploring the neighborhoods of Redlands was incredibly nostalgic since it reminds me so much of the part of Burbank that I grew up in, but haven’t had much opportunity to visit since.  I left  Burbank, CA when I 11 and the next year the city’s landscapes became the set for the TV show “The Wonder Years.”  I was 12 just like Kevin Arnold was, and despite a serious lack of Winnie Cooper in my youth, the show still resonates with me as does the Southern California landscape.

See on geographyeducation.org

World Policy Analysis Center

The World Policy Analysis Center aims to improve the quantity and quality of comparative data available to policymakers, citizens, civil society, and researchers around the world on policies affecting human health, development, well-being, and equity.

Seth Dixon‘s insight:

Following seven years of data collection, the World Policy Analysis Center recently launched a series of over 100 easy-to-understand maps of current laws, policies, and constitutional rights in 193 countries. They are eager to share this information and the maps that we have created and believe it will help engage geography students. The maps address questions such as

  • In which countries can you finish high school without paying tuition?
  • In which countries can you attend college without paying tuition?
  • In which countries are you legally protected from marriage at an average high school student’s age?
  • In which countries are you legally protected from working full-time at an average high school student’s age?
  • In which countries are men and women guaranteed equity in their country’s constitution?
  • In which countries are people of different ethnicities guaranteed equity in their country’s constitution?
  • In which countries does the constitution guarantee a right to medical services?


This data could provide exciting teaching tools to help students think about the implications of laws and policies around the world, particularly as they affect teenagers.


See on world.ph.ucla.edu

Welcome to ‘Geography Education’

WebAPP

Finding Materials: This site is designed for geography students and teachers to find interesting, current supplemental materials.  To search for place-specific posts, browse this interactive map.  To search for thematic posts, see https://geographyeducation.org/thematic/ (organized by the APHG curriculum).  Also you can search for a keyword by clicking on the filter tab above.

Staying Connected: You can receive post updates in the way that best fits how you use social media.

Update Notifications: Twitter, Facebook, Pinterest, Google+.

Sites with Content: WordPress, Scoop.it.

I hope that you enjoy the content and materials that you find on this website.  This represents the best news, materials and resources that I have found that can be used in geography (and other) classrooms. 

See on www.arcgis.com

Great Web Maps

Seth Dixon‘s insight:

Today was the first of the T3G Institute at the Esri headquarters and the wonderful team has shared great resources that I found incredibly useful for teachers to use great web maps.  So what makes a great web map. A great web map should be highly interactive, intuitive, and be able to function at various scales.  This video helps to show the power of maps to help tell a great story or to share spatial content. 

The presenters each shared an exemplary web map.

  • Lyn Malone selected a modern language map.
  • Charlie Fitzpatrick chose a land use change map with satellite imagery.
  • Amy Work highlighted a great storymap that shows global food supply data.
  • Roger Palmer selected a map from an AAG project Changing Planet.
  • Joesph Kerski created a map to show a impact of a proposed new road in the Serengeti.  
  • Kathryn Keranen shared a great iOS app QuakeFeed.

Tags: GIS, ESRI, mapping, cartography, geospatial, edtech, geography education, unit 1 GeoPrinciples.

See on www.youtube.com

T3Glogo

Blog at WordPress.com.

Up ↑