Search

GEOGRAPHY EDUCATION

Supporting geography educators everywhere with current digital resources.

The World’s Driest Desert Is in Breathtaking Bloom

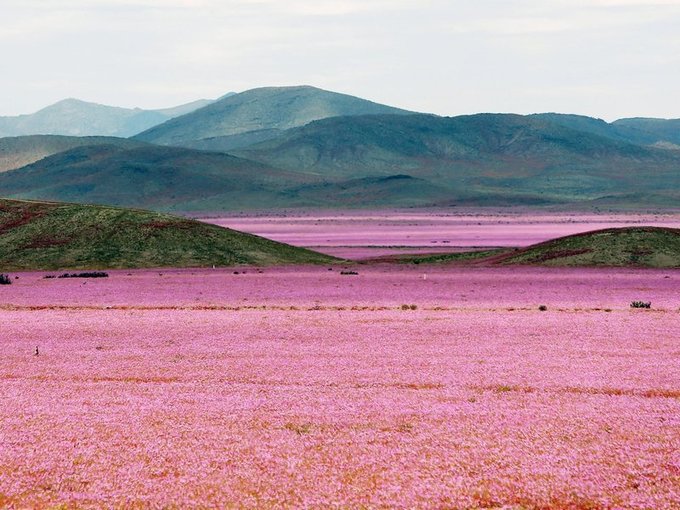
“After historic rains, Atacama, Chile is exploding with vibrant wildflowers.  Here’s a softer side to the disruptive weather phenomenon known as El Nino: an enormous blanket of colorful flowers has carpeted Chile’s Atacama desert, the most arid in the world. The cyclical warming of the central Pacific may be causing droughts and floods in various parts of the world, but in the vast desert of northern Chile it has also caused a vibrant explosion of thousands of species of flowers with an intensity not seen in decades.”

Source: www.smithsonianmag.com

The driest place on Earth, the Atacama Desert in South America, has spectacular vistas and biogeography … especially when it rains.  To read more (and see some stunning images) check out the links from the Washington Post, Yahoo, and the Smithsonian Magazine.   It is amazing that life can flourish in even some of the harshest of physical environments. 


Tags: physical, ChileSouth America, biogeography, environmentecology.

China to end one-child policy

“All couples will now be allowed to have two children, the state-run news agency said, citing a statement from the Communist Party. The controversial policy was introduced nationally in 1979, to reduce the country’s birth rate and slow the population growth rate. However, concerns at China’s aging population led to pressure for change.”

Source: www.bbc.com

The most extensive and controversial anti-natalist program in the world was China’s one-child policy. Experts have been concerned with how fast China is aging and that the population was shrinking faster than would be healthy for the economy. Today that policy was been relegated to the history books, but the impacts of the policy will continue to have far-reaching impacts (for more see the CNN video, Guardian article, and BBC video/article).


TagsChina, populationdeclining populations, unit 2 population, gender.


China’s Maritime Claims

ONE reason China’s spectacular rise sometimes alarms its neighbours is that it is not a status quo power. From its inland, western borders to its eastern and southern seaboard, it claims territory it does not control.

Source: www.youtube.com

Many of the geopolitical conflicts in the East Pacific have their roots in the territorial disputes over islands that at first glance seem as if they wouldn’t be worth the trouble; how did this become a tense situation?  Since the UNCLOS agreement gives countries 200 nautical miles off their coasts to be an Exclusive Economic Zone, that greatly enhanced the strategic value of controlling these islands and the shipping lanes.  The United States, to counter Chinese claims, has used the Navy to go near some of the claimed (and reclaimed) islands recently.  This interactive map briefly highlights some of the details behind the conflicts with links for further readings. 


Questions to Ponder: Why do countries care so much about some minor islands?  Why would other countries not want to accept China’s territorial assertions?


Tags: borders, political, conflict, China, East Asia.

Every Job in America, Mapped

Are you one of the millions of Americans opting into “job sprawl” over a short commute?

Before you dig in to “Where are the Jobs?: Employment in America 2010,” it may help to note that each dot represents a single job—and you can tell what kind of job it is because of its color. Manufacturing and trade jobs are red; professional services jobs are blue; healthcare, education, and government jobs are green; and retail, hospitality, and other service jobs are yellow. You won’t find any dots for federal jobs (no available data), and Massachusetts is missing entirely—the only state to opt out of reporting its employment trends. The end result is a highly detailed map that gives viewers a quick summary of how many and what types of jobs are a part of the economy.


Tags: economic, labor, USA, transportation, industry.

Source: magazine.good.is

Massive landslides caught on camera

A complete collection of the biggest mudslides and rockslides from around the world.

Source: www.youtube.com

This is a terrifying and mesmerizing compliation that shows the raw power of the Earth.  

Tags: physical, geomorphology, erosion, landforms.

The Atlas of Economic Complexity

“The Atlas is a powerful interactive tool enabling policy makers, entrepreneurs, academics, students and the general public to map the path of diversification and prosperity for 128 countries.  The tool will allow users to explore growth opportunities by country and industry, with the potential to provide input into economic policy and private investment decisions. The analysis may also be used to inform the agendas of development banks in policy recommendations and loan programming; an entrepreneur developing a market plan; an investment promotion agency pitching a new factory, as well as guide other choices we have yet to imagine.” http://wp.me/P2dv5Z-21a

Source: www.youtube.com

This video is an introduction to the Atlas of Economic Complexity; in it they use the visualization tool to analyze the Netherlands’ economy and the cut flower industry.  The Atlas of Economic Complexity is hosted by the Center for International Development at Harvard University (MIT also worked on this project and on their site it is called the Observatory of Economic Complexity).


Tags: developmentindustry, visualization, statistics, economicNetherlandsvideo.

World Religion Map

The incredibly detailed map of the world’s religions shows what the biggest religion is by census area in each country, along with its level of support.

Source: brilliantmaps.com

Mapping religion can be incredibly problematic, but this map (hi-res here) uses the best data available for each country.  Examine some of the regional maps (Asia, Europe, North America, Oceania); what patterns are interesting/surprising to you? 


Tags: culturereligion.

How Chicago became the country’s alley capital

How Chicago became the alley capital of the country and why so much of the rest of the region is conspicuously alley-free.

Source: www.wbez.org

The alley is a reminder of past visions of how to best lay out a city.  In the 19th century, back when Chicago started booming, the city was laid out in a grid and it quickly became a filthy, stinky, disease-ridden place. “Rear service lanes were essential for collecting trash, delivering coal, and stowing human waste — basically, keeping anything unpleasant away from living quarters.”  As we have moved towards curvilinear residential streets and more discrete public utilities, the newer neighborhoods abandoned the alley, but they are still very prominent in old neighborhoods (click here for an interactive map to explore all of Chicago’s alleys). 

Also, Chicago’s suburbs have lofty names (Mount, Heights, Ridge, etc.)  that don’t match this flat topography–read here to find out why.  


Tags: Chicago, urban, placetoponyms, planning, urbanism.

Climate Change Is Here

Record heat, fading ice, and rising seas show how climate change is affecting us. But there’s new hope we can cool the planet. Here’s how.

Source: www.nationalgeographic.com

The National Geographic Magazine has recently created this interactive to accompany the magazine article on climate change (for those worried that the editorial direction would not be as environmentally focused because of the recent changes for the National Geographic Society, I think this is a resounding way for them to emphatically declare that they are committed as ever to their core values and mission).  This interactive is richly-laden with videos, images and case-studies, showing the tangible impacts of climate change and lays out what the future implications of these changes.  The interactive is organized to answer these main questions:

  • How do we know it’s happening?
  • How do we fix it?
  • How do we live with it


Tags: physical, weather and climateenvironment, National Geographic, climate change, water.

Blog at WordPress.com.

Up ↑