Search

GEOGRAPHY EDUCATION

Supporting geography educators everywhere with current digital resources.

Tag

coastal

As Climate Change Accelerates, Floating Cities Look Like Less of a Pipe Dream

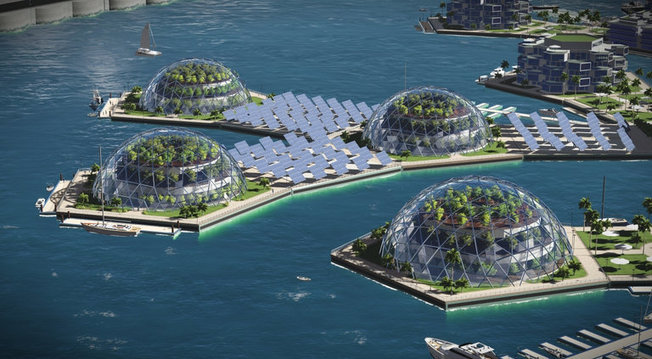
A costly plan to build floating islands shows how climate change is pushing the search for innovative solutions, but some critics ask who will ultimately benefit.

Source: www.nytimes.com

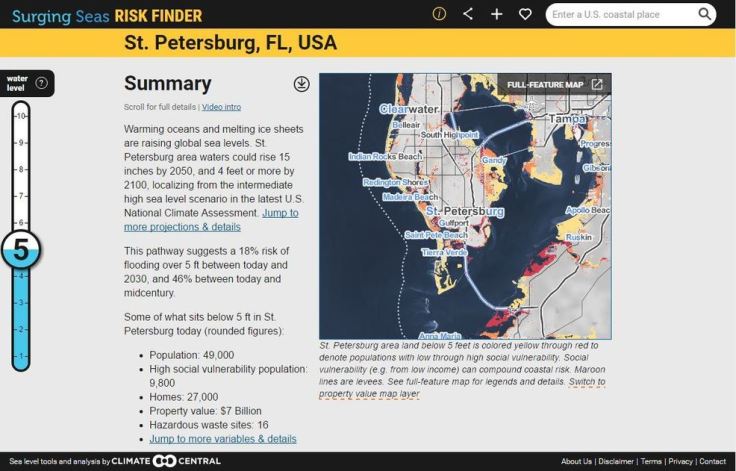
As coastal communities are considering what the tangible impacts of climate change might be, things that were once considered science fiction could be a part of how people adapt to the modifications we’ve collectively made to our global environment that we depend on to sustain life.  


Tags: physicaltechnologysustainability, climate change, environment, resources, watercoastal, environment dependenvironment adapt, environment modify.

Creating RI’s Off-Shore Wind Farm

Today, to the southeast of Block Island, there are five new structures rising from the ocean. These are the towers of the Block Island Wind Farm (BIWF), the first offshore wind energy installation in the United States. The turbines will generate 30 megawatts of energy; providing electricity to 17,000 households on Block Island and coastal Rhode Island (McCann, 2016), and replacing the diesel generators that previously powered New Shoreham. The turbines are on schedule to begin turning in November 2016 once commissioning is complete.

Source: uri.maps.arcgis.com

One of the overriding, major take-home points of this ESRI StoryMap, is that a project of this scale, scope, and magnitude requires geographic data across many disciplines (to see the largest off-shore wind farm in the world, click here).


Tags: mapping, Rhode IslandESRIStoryMap, GISresources, water, coastalenergy, environment depend.

WORKSHEETS: Climate Migrants

“The ESRI storymap on climate refugees does a phenomenal job sampling locations in the world that experience migration effects as a result of climate change. Attached is a guided worksheet that accompanies the ESRI Climate Migrant Storymap.”

Source: www.thehumanimprint.com

This StoryMap shows some key regions where migrants are fleeing some of the negative impacts of climate change and one APHG teacher has created a fabulous worksheet to guide students through this great resource.   


TagsAPHG, climate changemigrationrefugees, environment, coastalmappingESRIStoryMap, political ecology.

Climate Migrants

Climate change has already displaced tens of thousands of people. If it continues unabated, it could lead to one of the largest mass human migrations in history.

Source: storymaps.esri.com

This StoryMap shows some key regions where migrants are fleeing some of the negative impacts of climate change, a trend that appears very likely to increase in the future.  It is also an excellent example of the ESRI’s new Cascade template for creating a web app. 


Tags: physical, weather and climate, climate change, environment, resources, watercoastalmappingESRIStoryMap, visualization, environment depend, political ecology.

A Medieval Abbey Trapped by Tides and Time

“Mont Saint-Michel emerges from the tides in Normandy, France, like an ancient village from a fairytale. The coastal town built on a massive granite rock cuts a dramatic silhouette against the sky, rising from disappearing marshes to a Gothic Abbey at its height. With a permanent population of around 50, this popular tourist destination has a history dating back to at least the Roman era. Fancy a tour before the tides roll in?”

Source: www.youtube.com

Coastal physical geography produces some beautiful landforms such as tombolos.  A tombolo is created when sand deposits attach an island to a larger piece of land–think of it as special type of isthmus.  Mont St. Michel is the world’s most famous example because of the iconic walled city with crowned with a striking medieval abbey.  This is one of those fascinating places for both the human and physical geographer.   


Tags: water, physical, coastal, geomorphology, landformsFrance, historical, tourism.

Louisiana in Tough Shape

Unlike the many maps we have seen that show what Florida, Boston, or some other coastal location would look like with higher sea levels, the figure above compares the iconic outline of Louisiana with the present-day outline of its dry land. An important caveat is that some of the removed areas are wetlands, meaning they are not under water all the time, but those lands are not available for most human uses (aside from fishing), so this outline warrants attention.

Source: environmentalgeography.blogspot.com

Last month I was in New Orleans, Louisiana and I’m so disheartened to know that thousands have their homes under water.  As stated in this article, “the boot is at best an inaccurate approximation of Louisiana’s true shape and, at worst, an irresponsible lie.”  To explore the issue yourself, this gorgeous interactive map pulls together some high quality source materials on a wide range of issues to look at this environmental issues of this region in a holistic manner.


Tags: environmentweather and climatecoastal, water, disasters

Surging Seas Interactive Map

Global warming has raised global sea level about 8″ since 1880, and the rate of rise is accelerating. Rising seas dramatically increase the odds of damaging floods from storm surges.

Source: sealevel.climatecentral.org

This interactive map from Climate Central dramatically shows what locations are most vulnerable to sea level rise.  You can adjust the map to display anywhere from 1 to 10 feet of sea level rise to compare the impact to coastal communities.  This dynamic map lets to view other layers to contextualize potential sea level rise by toggling on layers that include, population density, ethnicity, income, property and social vulnerability.   


Tags: physical, weather and climate, climate change, environment, resources, watercoastalmapping, visualization, environment depend, political ecology.

Coast Lines

In the next century, sea levels are predicted to rise at unprecedented rates, causing flooding around the world, from the islands of Malaysia and the canals of Venice to the coasts of Florida and California. These rising water levels pose serious challenges to all aspects of coastal existence—chiefly economic, residential, and environmental—as well as to the cartographic definition and mapping of coasts. It is this facet of coastal life that Mark Monmonier tackles in Coast Lines. Setting sail on a journey across shifting landscapes, cartographic technology, and climate change, Monmonier reveals that coastlines are as much a set of ideas, assumptions, and societal beliefs as they are solid black lines on maps.

Source: www.press.uchicago.edu

I haven’t yet had the chance to look at this book, but it is currently being offered as a free e-book; I’m very excited to look it over.   


Tagsmappingcoastal, cartography, textbook.

Blog at WordPress.com.

Up ↑