Search

GEOGRAPHY EDUCATION

Supporting geography educators everywhere with current digital resources.

Tag

mapping

xkcd: Map Age Guide

Source: xkcd.com

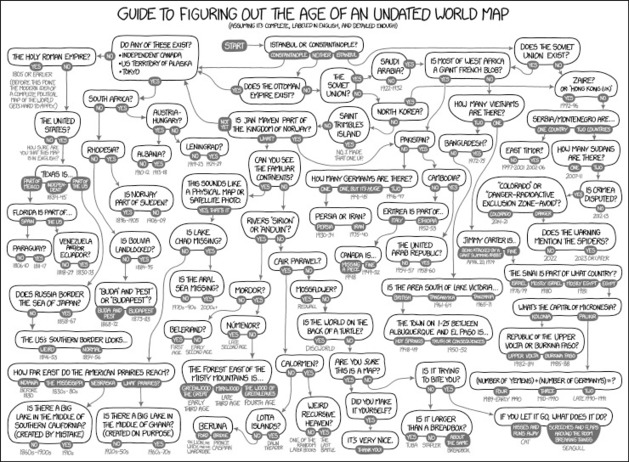
I was riding my bike during Labor Day weekend and chanced upon a yard sale with an old globe going for $4 (of course I bought it and rode home one-handed).  There were some clues that it wasn’t a recent globe (The Soviet Union and Yugoslavia still existed and Burkina Faso was labeled Upper Volta and Zimbabwe was listed as Rhodesia). I knew that if I wanted to know what year this globe was produced, I would need this XKCD guide. XKCD is a comic strip that deals with many intellectual issues, but it can also be a wealth of quality scientific information.  This infographic (hi-res) is amazingly useful if you are trying to find the map of an undated map, but the flow chart also is a wealth of global history and moments that ‘changed the map.’


Tags: XKCD, artinfographic, mapping, trivia, cartography.

How to Say ‘Banana’ in Spanish

Source: i.imgur.com

I’ve lived in both the plátano and banano sub-regions of the Spanish-speaking realm and this discrepancy was one I always found curious (likewise, peanut butter is called crema de cacahuate in Mexico, but mantequilla de maní in Costa Rica). I’ve had many humorous encounters with friends from throughout the Spanish-speaking world when words that mean one thing in a particular country have VERY different connotations in another.


Questions to Ponder: Why do languages have different vocabularies in distinct places?  Why makes a language especially prone to a varied set of regionalized terms?


Tags: language, colonialismdiffusion, culture, mapping, regions.

Climate Comparison Maps

Triton1982 makes maps by comparing each of the city’s highest and lowest average temperatures against the Koppen classification system.”

Source: www.triplem.com.au

Many maps are shared on Reddit, and this series of maps help make some far off places easier to relate to.  I think these cross-regional comparisons can also help students also see that countries can have a great degree of internal variety.  


Tags: Australia, Oceania, mapping, visualization 

All Maps Are Biased. Google Maps’ New Redesign Doesn’t Hide It.

“Google rolled out its new Maps design…from a navigational tool to a commercial interface and offers the clearest proof yet that the geographic web—despite its aspirations to universality—is a deeply subjective entity.”

Source: www.slate.com

Google Maps was updated over the summer, and the updates don’t make them more impartial, but that isn’t a bad thing.  Google Maps now highlight ‘Areas of interest,’ which are created with algorithms designed to reveal the “highest concentration of restaurants, bars, and shops.” The algorithms aren’t ‘objective,’ but are fine-tuned by human engineers to reflect what they consider ‘Areas of Interests’ should look like.  Maps are never as objective as they appear to be, and that can often be a great thing. 


Tags: google, mapping, geospatial, cartography, visualization.

Why I make cartograms with second graders

“There are few sights more heartening than that of an elementary school whose classrooms and hallways are decorated with world maps. Yet teachers should be careful to make sure that the standard depiction of the world map is not the only map their students encounter. Otherwise, they run the risk that children will assume ‘this is the way the world looks,’ rather than the more complicated reality that ‘this is one of many ways of representing our world.’ One useful antidote to this way of thinking is for students to explore cartograms, which are maps that use the relative area of places to present statistical data.  Please check out my cartogram lesson plan.”

Source: populationeducation.org

I love this post because it shows that–adjusting for mathematical proficiency and cartographic skill–just about any group of students can work on projects to work with data and explore various ways of how to represent that data.  


Tagseducation, K12geography education, statistics, spatial, mapping. 

Map Men: teaching geography through comedy

Mark Cooper-Jones and Jay Foreman, the Map Men, tap into a rich vein of geographical quirks to teach through comedy

Source: geographical.co.uk

Why am I just now finding out about this resource?!?  This new YouTube channel is full of promise for geography teachers…fun, quirky, full of interesting trivia, but most importantly, these videos are rooted in geographic concepts. 


Tags: mappingfun, videoAPHG, geography education, unit 1 GeoPrinciples.

Olympic Races, in Your Neighborhood

“What would Olympic races look like if they took place near you? Enter your address below to find out, or keep clicking the green button to explore races that begin in where you live.”

Source: www.nytimes.com

I thought I was done with the Olympics, but this just sucked me right back in…in the most geographically relevant way possible.  Scale and distance are important geographic concepts and realizing JUST HOW FAST these Olympians are on the TV can be deceptive when they are paired up with other great Olympians.  Seeing how far in your own neighborhood you would have to go to beat the 400m champion–or the 5000m.  Since the United States doesn’t use the metric system, this map is a good way to contextualize these measurements and try to run the race in your own backyard.  Let the Backyard Games begin!!


Tags: mappingfunscaledistance, sport, unit 1 GeoPrinciples.  

Interactive Climate Map

“Obsessed as we are with cartography we in Staridas Geography perceive any aspect of the actual 3D World as a constant opportunity for another pretty map creation!”

Source: staridasgeo.maps.arcgis.com

This is a great interactive map of the world’s climate zones. 


Tags: ESRIStoryMapedtech, GIS, mapping, cartographyphysical.

Do You Know The Outline of These Countries?

Can you spot the real outline from the fake?..

Source: www.buzzfeed.com

This is just for fun…The borders/coastlines of these 14 countries are slightly photoshopped in one of the two images, and you have to remember from your mental maps which one is correct.  And yes, of course I got a 14. 


Tagsmapping, trivia, funborders, cartography.

Blog at WordPress.com.

Up ↑