Search

GEOGRAPHY EDUCATION

Supporting geography educators everywhere with current digital resources.

Tag

mapping

Maps of racial diversity in the United States

“Repurposed NASA maps show the racial diversity (and segregation) of the United States in more detail than ever before.”

Source: geographical.co.uk

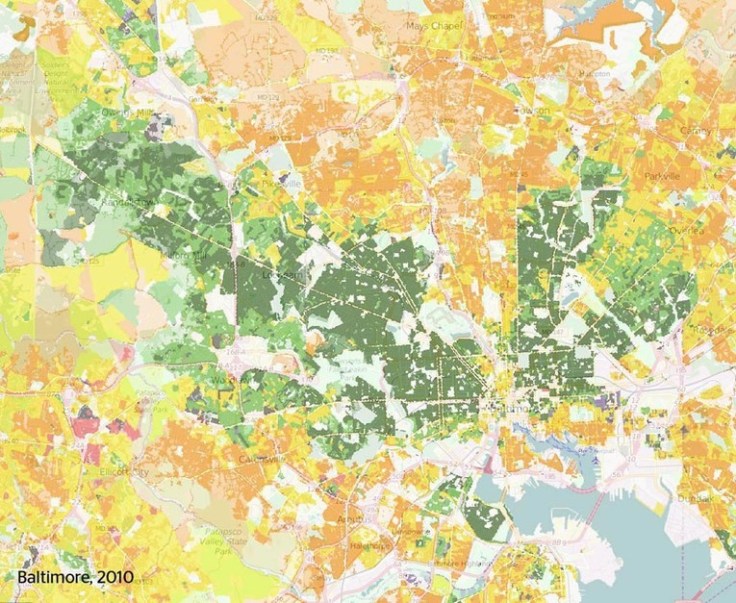
This interactive map of population density in the United States also shows ethnic categories as defined by the U.S. census.  Please explore this map at a variety of scales and in distinct locales.   


Questions to Ponder: Is this a map of ethnic diversity patterns or is it a map of racial segregation?  How come?  Is there additional information that you would need to decide?  This review of the map on Wired and Atlantic Cities described this map as a map depicting segregation: why would they say that? 


Tags: mapping, density, ethnicity, race.

Lights of Human Activity Shine in NASA’s Image of Earth at Night

NASA scientists have just released the first new global map of Earth at night since 2012. This nighttime look at our home planet, dubbed the Black Marble, provides researchers with a unique perspective of human activities around the globe. By studying Earth at night, researchers can investigate how cities expand, monitor light intensity to estimate energy use and economic activity, and aid in disaster response.

Source: www.youtube.com

NASA scientists are releasing new global maps of Earth at night, providing the clearest yet composite view of the patterns of human settlement across our planet.  You can download the image at a good resolution (8 MB jpg) or at a great resolution (266 MB jpg) to explore at your leisure.  


Tags: mapping, perspective, images, geospatial.

Mapping Reading Preferences

We took a look at how some of your favorite genres play out across the country.

Source: trends.audible.com

Audible is one of the world’s largest audio book distributors and they have recently mapped out their customers buying patterns at the state level, looking at nine genres.  


Questions to Ponder: What patterns do you see in this set of maps?  What cultural and economic factors help to explain the spatial patterns that you see? 


Tagsmapping, cultureEnglish.

Boston schools ditch conventional world maps in favor of this one

Social studies classrooms throughout the Boston public school system are getting an upgrade some 448 years in the making.

Source: www.bostonglobe.com

Personally, I’m not a fan of this decision, but it’s as if they watched the classic West Wing clip and decided to roll with it. I think that the Peters projection map is better than the Mercator for most educational applications, but it isn’t the “right, best, or true” map projection.  Many viral videos comparing the two love to exaggerate and say things like “The maps you use are lying to you” or “the world is nothing like you’ve ever seen.”  Yes, Mercator maps distorts relative size, but it isn’t a “wrong” map anymore than the Peters projection.  All maps have distortion and map readers need to under that all maps are a mathematical representation of the Earth.  


Tags: mapping, visualization, map projections, cartography, perspectiveeducation, geography, geography educationBoston.

U.S.G.S. Topographical Maps

Think of them not as cartographic abstractions, but as incredibly affordable Pollocks.

Source: www.nytimes.com

Good cartography lies at the intersection of rigorous scientific data display and a aesthetic touch of beauty.  This article is an ode to the beauty of USGS topographic maps as affordable pieces of art.  Geography students that start their own mapping projects need to recognize that good cartographic work often needs to be both an art and a science to fit the needs of their intended audience. 


Tags: cartography, visualization, mapping, artgeo-inspiration.

Flat Earth Theory

Source: www.youtube.com

I think we all need a laugh sometimes.  Flat earth videos are incredibly entertaining.  


DISCLAIMER THAT I WISH I DIDN’T HAVE TO MAKE: I don’t believe in the flat Earth theory and think that this video is total jibberish; but it is delightfully inaccurate!  This is a good way to get students to think critically about epistemology (how we know what we know) and defend their own world view.  This also helps students to assess the validity of online sources


Tagsfun, mapping, social media.

The Geography Teacher’s Introduction to OpenStreetMap

“Wed, Mar 15, 2017 8:00 PM – 9:00 PM EDT, the NCGE will be offering a free webinar for educators on the OpenStreetMap project and how you can incorporate it into your class.”

Source: attendee.gotowebinar.com

My students and I join OpenStreetMap (OSM) projects, especially when there is a major humanitarian need…it’s a great way to make service learning and geospatial technologies come together. If you are interested learning more about OSM projects for the classroom, sign up for this NCGE webinar seminar as soon as possible, since this event is right around the corner (the webinar program is one of the many great reasons to become a member of NCGE). 


TagsNCGE, mappingedtech, cartography, geospatial, disasters, STEM.


This computer programmer solved gerrymandering in his spare time

We could take human error out of the redistricting process entirely. Why don’t we?

Source: www.washingtonpost.com

This computer programmer (code word in the newspapers for geographers using GIS) has created a way to take the human element out of the redistricting process.  Dividing places into separate, formal regions is an important task, one that often times requires an intimate knowledge of the place, it’s cultural, economic and physical characteristics.  That’s how I would want things to been done in a perfect world, but partisan chicanery has led to so many gerrymandered districts that the human touch is what many of us fear more than a cold, impersonal division that does not take place, history, and community into account.    


Questions to Ponder: Do you trust the politicians that are in charge of your state to create better districts than computer-generated districts that are optimized for compactness?  What are some of the potential limitations of compact districts?  Would an independent committee/bipartisan group do a better job? How does the Voting Rights Act complicate the redistricting process?    


Tags: gerrymandering, politicalmapping, cartography, GIS, unit 4 political.

Google Maps Smarty Pins

Smarty Pins is a Google Maps based geography and trivia game.

Source: smartypins.withgoogle.com

As stated in a review of Smarty Pins on Mashable, “Google unveiled a fun new game this week that tests players’ geography and trivia skills.  Called ‘Smarty Pins’ the game starts players off with 1,000 miles (or 1,609 kilometers if they’re not based in the United States), and asks them to drop a pin on the city that corresponds with the correct answer to a given question.” 


This game is wonderfully addictive…I haven’t enjoyed a mapping trivia platform this much since I discovered GeoGuessr.  How far can you get before you run out of miles?  


Tagsgoogle, fun, mapping, place, trivia.

Create a free website or blog at WordPress.com.

Up ↑