Search

GEOGRAPHY EDUCATION

Supporting geography educators everywhere with current digital resources.

Tag

visualization

Tornado Alley

Interested in learning about tornado alley? Then you’ll want to read our tornado alley facts and information. Tornado Alley 101

Source: www.tornadofacts.net

This map nicely shows the particular air requirements needed for a tornado to form and why the part of the United States known as Tornado Alley accounts for the majority of the world’s tornadoes.  This nicely shows how physical geographic factors form a major part of how a region might be defined and conceptualized. 


Tags: tornado, physical, weather and climate, visualization, regions.

A More Accurate World Map Wins Prestigious Japanese Design Award

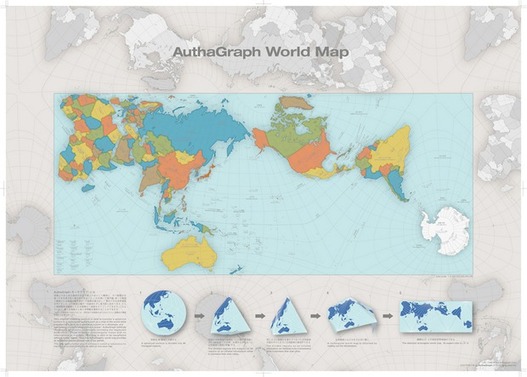
“To design a map of the world is no easy task. Because maps represent the spherical Earth in 2D form, they cannot help but be distorted, which is why Greenland and Antarctica usually look far more gigantic than they really are, while Africa appears vastly smaller than its true size. The AuthaGraph World Map tries to correct these issues, showing the world closer to how it actually is in all its spherical glory.”

Source: mentalfloss.com

This just shows how subjective the concept of “accurate” can be. First off, this is a fabulous map that nicely minimizes distortions (distance, direction, area, and shape) of the land on our planet. Any criticism of the map just shows the impossibility of making an accurate 2D map of a 3D Earth, but I still think that there is plenty of room to discuss the flaws/distortions that were chosen instead of others. It is interesting to note that a Japanese contest awarded this map with it’s top honor (I doubt a Brazilian organization would feel the same way about this map). This map does make with some traditional cartographic conventions in its representation of Earth.  


Questions to Ponder: What are some elements of this map that are different from more traditional maps? This map claims to be more accurate; does that make it more useful?    


Tags: visualization, mapping, cartography, geospatial, technology.

Who Likes Whom in The Middle East? Key players & Notable relationships

An interactive network visualisation of key players & notable relationships in the Middle East region. Continually updated. Awesome looking.

Source: www.informationisbeautiful.net

News flash:the Middle East is complicated.  In a region where the enemy of an enemy can be your friend, keeping track of local, regional, and global interests can be a staggering proposition.  This flow chart is both incredibly complex, but also aids the user in making sense of the relationships that help to define the region.  


Tags: MiddleEast, conflict, political, geopoliticsregions.

Why Hurricane Categories Make a Difference

During a hurricane you usually hear meteorologists refer to its intensity by categories. If you don’t know the difference between a category 1 and a category 5 hurricane, The Weather Channel meteorologist Mark Elliot breaks it down for you.

Source: www.youtube.com

With Hurricane Matthew having just hit Haiti (video) and Cuba, it now poised to strike Florida. Many are unsure what the term “category 4” actually means because they are unfamiliar with the Saffir-Simpson Hurricane Wind Scale.  This video is a good introduction to what this means to people in the path of the hurricane. As we monitor this (and future) situation, these are my favorite digital globes that display wind speeds and a few other of Earth’s physical systems. What is beautiful and majestic from one scale can be horrific and catastrophic at another:    


Tagsphysical, weather and climatedisasters, mapping, visualization.

Climate Comparison Maps

Triton1982 makes maps by comparing each of the city’s highest and lowest average temperatures against the Koppen classification system.”

Source: www.triplem.com.au

Many maps are shared on Reddit, and this series of maps help make some far off places easier to relate to.  I think these cross-regional comparisons can also help students also see that countries can have a great degree of internal variety.  


Tags: Australia, Oceania, mapping, visualization 

All Maps Are Biased. Google Maps’ New Redesign Doesn’t Hide It.

“Google rolled out its new Maps design…from a navigational tool to a commercial interface and offers the clearest proof yet that the geographic web—despite its aspirations to universality—is a deeply subjective entity.”

Source: www.slate.com

Google Maps was updated over the summer, and the updates don’t make them more impartial, but that isn’t a bad thing.  Google Maps now highlight ‘Areas of interest,’ which are created with algorithms designed to reveal the “highest concentration of restaurants, bars, and shops.” The algorithms aren’t ‘objective,’ but are fine-tuned by human engineers to reflect what they consider ‘Areas of Interests’ should look like.  Maps are never as objective as they appear to be, and that can often be a great thing. 


Tags: google, mapping, geospatial, cartography, visualization.

The dirty little secret that data journalists aren’t telling you

How to tell two radically different stories with the same dataset.

Source: www.washingtonpost.com

Mapping matters, but that doesn’t mean that maps convey an objective truth.  They are rhetorical devices used to convince and persuade.  So approach maps critically because while they can convey great spatial patterns, they can conceal patterns just as easily.  


Tagsstatisticscartography, visualization, mapping.

Surging Seas Interactive Map

Global warming has raised global sea level about 8″ since 1880, and the rate of rise is accelerating. Rising seas dramatically increase the odds of damaging floods from storm surges.

Source: sealevel.climatecentral.org

This interactive map from Climate Central dramatically shows what locations are most vulnerable to sea level rise.  You can adjust the map to display anywhere from 1 to 10 feet of sea level rise to compare the impact to coastal communities.  This dynamic map lets to view other layers to contextualize potential sea level rise by toggling on layers that include, population density, ethnicity, income, property and social vulnerability.   


Tags: physical, weather and climate, climate change, environment, resources, watercoastalmapping, visualization, environment depend, political ecology.

Half the World Lives on 1% of Its Land, Mapped

“Data viz extraordinaire Max Galka created this map using NASA’s gridded population data, which counts the global population within each nine-square-mile patch of Earth, instead of within each each district, state, or country border. Out of the 28 million total cells, the ones with a population over 8,000 are colored in yellow.”


Tags: population, density, mapping, visualization.

Source: www.citylab.com

Blog at WordPress.com.

Up ↑