Search

GEOGRAPHY EDUCATION

Supporting geography educators everywhere with current digital resources.

Tag

water

Sinkhole looks like an abyss, recharges aquifer

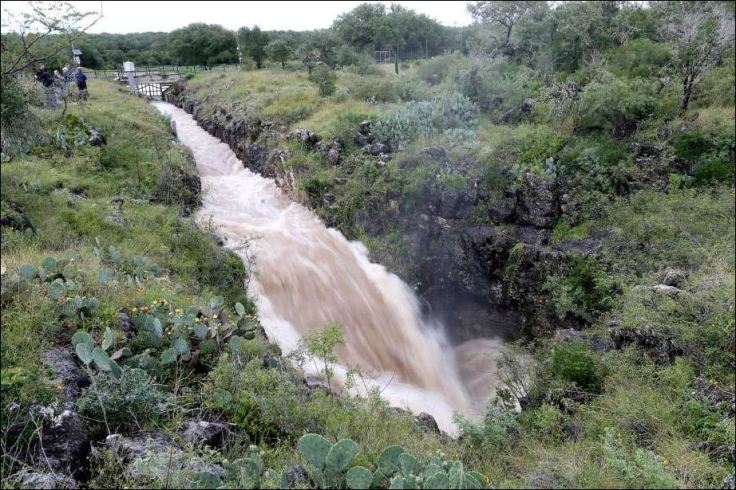
At this sinkhole, about 500 cubic feet of water per second is disappearing into the earth, the equivalent of an Olympic-sized swimming pool every three minutes, according to an engineer with the Edwards Aquifer Authority. For as much water reaches the aquifer at this spot, far more infiltrates through porous rock across South-central Texas.

Source: www.mysanantonio.com

Not all water runoff goes to rivers, lakes, and oceans.  Some water percolates into soils that can absorb water (aquifers) but there are some soils such as clay that can’t absorb water (aquicludes or aquitards).  In this dramatic example (see video), the water is not absorbed by the resistant rock, flows through a sinkhole to recharge the aquifer below.    


Tags: physical, geomorphologywater, erosion.

The Depths of the Unseen Ocean

“The depths below the ocean’s surface comprise a staggering 95 percent of the Earth’s living space, and much of it is unexplored by humans. To put into perspective just how deep the oceans go, this XKCD comic, (hi-res image).  Most of the ocean doesn’t even see sunlight. Even scientists aren’t familiar with everything that’s down there.”

Source: www.sciencealert.com

XKCD is a comic strip that deals with many intellectual issues, but it can also be a wealth of quality scientific information.  This infographic on the oceans is staggering.


Tags: XKCD, artinfographic, physical, environmentwater.

Louisiana in Tough Shape

Unlike the many maps we have seen that show what Florida, Boston, or some other coastal location would look like with higher sea levels, the figure above compares the iconic outline of Louisiana with the present-day outline of its dry land. An important caveat is that some of the removed areas are wetlands, meaning they are not under water all the time, but those lands are not available for most human uses (aside from fishing), so this outline warrants attention.

Source: environmentalgeography.blogspot.com

Last month I was in New Orleans, Louisiana and I’m so disheartened to know that thousands have their homes under water.  As stated in this article, “the boot is at best an inaccurate approximation of Louisiana’s true shape and, at worst, an irresponsible lie.”  To explore the issue yourself, this gorgeous interactive map pulls together some high quality source materials on a wide range of issues to look at this environmental issues of this region in a holistic manner.


Tags: environmentweather and climatecoastal, water, disasters

How over 2 feet of rain caused historic flooding in Louisiana in less than 72 hours

All-told, over 20 inches of rain fell in less than 72 hours around Baton Rouge.

Source: www.washingtonpost.com

Last month I was in New Orleans, and it rained for about 2 hours…it was staggering to see how many issues stemmed from that drainage in such a flat floodplain.  This is so much worse.  This article focuses on the weather/environmental situation, and this one on the political/human impact.


Tags: urban ecology, environmentweather and climate, water, disasters

Surging Seas Interactive Map

Global warming has raised global sea level about 8″ since 1880, and the rate of rise is accelerating. Rising seas dramatically increase the odds of damaging floods from storm surges.

Source: sealevel.climatecentral.org

This interactive map from Climate Central dramatically shows what locations are most vulnerable to sea level rise.  You can adjust the map to display anywhere from 1 to 10 feet of sea level rise to compare the impact to coastal communities.  This dynamic map lets to view other layers to contextualize potential sea level rise by toggling on layers that include, population density, ethnicity, income, property and social vulnerability.   


Tags: physical, weather and climate, climate change, environment, resources, watercoastalmapping, visualization, environment depend, political ecology.

Live chart: Fish stocks

“The world’s fish are in danger—as is everyone who depends on them.”

Source: www.youtube.com

Every semester I share with my students this New York Times video about the rapid rise in industrial fishing and the production of Talapia.  Even with the rise of aquaculture as a major source of seafood, the world’s oceans are still depleted.  As the world’s population rises, many folk cultures with their roots in small fishing villages have transformed into primarily urban societies, but these urban societies still have a strong cultural preference for seafood and consume at levels that are not sustainable.    


Tags: environment modifyfolk culturesconsumption, water, physical.

How Geospatial Analytics Are Changing Habitat Conservation

“The BirdReturns program is an effort to provide ‘pop-up habitats’ for some of the millions of shorebirds, such as sandpipers and plovers that migrate along the Pacific Flyway, a route that spans from Alaska to South America. Birds flying on this journey seek out the increasingly rare wetlands teeming with tasty insects to fuel their long-distance flights.  Over the last century, California’s Central Valley has lost 95% of the wetlands habitat to development, agriculture, and other land use changes. As a solution, scientists use big data, binoculars, and rice paddies.”

Source: www.youtube.com

This project combines data from satellite imagery to map surface water in California’s Central Valley, and individual bird observations to select locations that can be temporarily converted into wetlands to aid the migratory birds (for more information than the video provides about this project, read this article). 


This is a great example of using both ‘big’ geospatial data as represented by the satellite imagery and combining it with field data and actual observations to make the world a better place.  We need more decision makers that can think spatially and use geographic skills.  


Tags: physicalCalifornia, water, environmentbiogeography, remote sensing.

Drought Drains Lake Mead to Lowest Level

“The largest reservoir in the U.S. falls to its lowest water level in history, Nevada State Sen. Tick Segerblom introduced a bill title and issued a press release on July 8 calling for an ‘independent scientific and economic audit of the Bureau of Reclamation’s strategies for Colorado River management.'”

This week’s history-making, bad-news event at Lake Mead has already triggered lots of news stories, but almost all of these stories focus on the water supply for Las Vegas, Phoenix and California. But what about the health of the river itself?

Tags: physicalfluvial, drought, water, environment.

Source: ecowatch.com

Ethiopia’s Dam Problems

“Ethiopia is three years from completing a dam to control its headwaters, and while Egypt points to colonial-era treaties to claim the water and to stop the project, the question remains as to who own the Blue Nile.”

Source: maps101blog.com

This 7-minute Geography News Network podcast (written by Julie and Seth Dixon) touches on some key geographic concepts.  85% of the Nile’s water comes from the Blue Nile that originates in the Ethiopian highlands–it is the Blue Nile that Ethiopia has been working on damming since 2011.  The Grand Ethiopia Renaissance Dam (GERD) will be located  near the border with Sudan.  Egypt is adamantly opposed to Ethiopia’s plan and is actively lobbying the international community to stop construction on the dam, fearing their water supply with be threatened. 

Tags: Ethiopia, Africa, development. environment, water, energy, borders, political.

Create a free website or blog at WordPress.com.

Up ↑