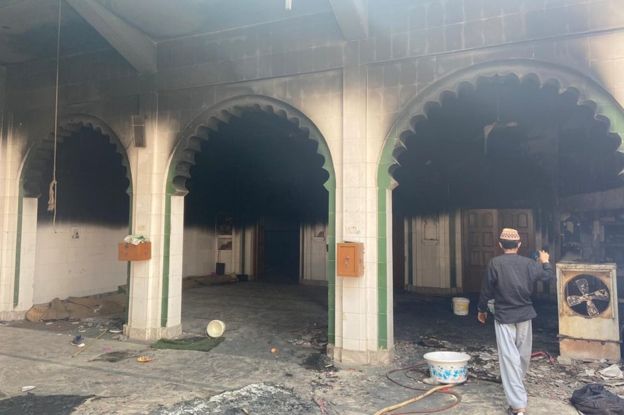
Search

GEOGRAPHY EDUCATION

Supporting geography educators everywhere with current digital resources.

On the edge of America, census begins in a tiny Alaska town

Alaska

The first Americans to be counted in the 2020 census live in [Toksook Bay, Alaska], a tiny community of 661 on the edge of the American expanse. Their homes are huddled together in a windswept Bering Sea village, painted vivid lime green, purple or neon blue to help distinguish the signs of life from a frigid white winterscape that makes it hard to tell where the frozen sea ends and the village begins. Once the spring thaw hits, the town empties as many residents scatter for traditional hunting and fishing grounds, and the frozen ground that in January makes it easier to get around by March turns to marsh that’s difficult to traverse. The mail service is spotty and the internet connectivity unreliable, which makes door-to-door surveying important. For those reasons, they have to start early here.” SOURCE: AP News.

This article is a reminder that while we are on preparing for the constitutionally-mandated 2020 census (get ready for updated maps everyone!!), the census is tasked with counting everyone.  Some populations such as this indigenous village in Alaska are harder to count than others.

Questions to Ponder: What are other populations that might be under-represented in the census?  What would be measures that census employees could take to count those people?  How does the census improve our ability to understand geographic patterns?

GeoEd Tags: indigenous, census.

99 Percent Invisible: Mini-stories

99PISocialShareImage_V1

The 99 Percent Invisible podcast is an excellent one for geography teachers as well as students.  So many episodes deal with the unspoken things that make our world the way it is—unnoticed architecture and design with a heavy dose of urbanism and the built environment.  The particular episode has four “mini-stories” and each of them has some compelling geographic/landscape component to it.

OMNIBUS

Also, here is a another great podcast with some trivia nerdiness from Ken Jennings (the Jeopardy champ who authored Maphead and presented at NCGE) is part of the Omnibus Project, a podcast with some excellent geographic nuggets (disclaimer: the language and content for this podcast is not always classroom-friendly).  Here are some geographic episodes about Cincinnati Chili, Alexander von Humboldt, Induced Demand (traffic), the Qibla, the Blue Men of the Sahara, the Port Chicago Disaster, Bir Tawil, the Sentinelese, and the Darien Gap.

GeoEd Tags: 99pi, podcast.

cover_medium
Only in Cincinnati will I eat this!  Listen to the Cincinnati Chili episode!

The Trails Leaving Venezuela

Venezuela Migrants

The rich were the first to leave. They wired their savings abroad and hopped on international flights. The middle class departed next. They went on buses, sometimes riding for days across several countries. The poor remained. They stayed as the economy collapsed, food got scarcer, medicine shortages turned deadly and the electricity cut out for days at a time. But finally, they too began to exit Venezuela. They simply walked out. The departure of the caminantes, or walkers, began slowly in 2017 with young men hoping to find jobs and send money home.

Now women and children, the sick and the elderly also are taking their chances, expanding an exodus that already is one of the biggest mass migrations in modern history. Each day an estimated 5,000 people flee.” SOURCE: LA Times

The economic, political, and demographic crisis in Venezuela might not be at the top of the headlines anymore, that that isn’t because the situation has gone away, but it just has become ‘normal.’   This article is an in-depth look at the lives of those fleeing Venezuela on foot into Colombia.

GeoEd Tags: migration, Colombia, Venezuela, refugees, South America.

Mapping the Wind

EarthNull

It is incredibly cold in New England right now.  How can maps help us to understand the weather patterns we are facing?  How is what we are facing in our community connected to global patterns?  Maps help us to contextualize information and understand processes.  So to investigate this our freezing wind conditions we will look at a series of online resources.

  1. Dynamic Wind Map of USA (Visualization).
  2. Interactive wind map (Ventusky).
  3. Interactive wind map (WindyTy).
  4. Digital Globe with Wind patterns (Null School)

GeoEd TAGS: physical,  weather and climate, mapping, visualization.

Why 40% of Vietnamese People Have the Same Last Name

Vietnam

“In the United States, the most popular last name is Smith. As per the 2010 census, about 0.8 percent of Americans have it. In Vietnam, the most popular last name is Nguyen. The estimate for how many people answer to it? Somewhere between 30 and 40 percent of the country’s population. The 14 most popular last names in Vietnam account for well over 90 percent of the population. The 14 most popular last names in the US? Fewer than 6 percent.”  SOURCE: ATLAS OBSCURA

So many things are cultural beyond language, religion, and ethnicity, but those are the biggies in book chapters and in the curriculum.  Should you strike up a conversation with that stranger in the elevator?  How far from home is it appropriate for children to go from the house unattended?  What clothes are appropriate for a teacher to wear in the classroom?  These are all questions about cultural norms, but we don’t think about them as cultural at times because we are so used to our own cultural context that it seems natural.  The importance of last names and naming conventions aren’t natural but are created by cultural norms and institutions.

GeoEd Tags: cultural norms, culture, Vietnam.

So here’s the condensed version from Atlas Obscura:

The entire idea of a family name was unknown to most of the world unless you were conquered by a place that used them. Those conquerors included the Romans, the Normans, the Chinese, and later the Spanish, the Portuguese, the Germans, and the Americans. It was the Chinese who gave Vietnam family names.

The last name, in Vietnam, is there, but just isn’t that important. And when it’s not that important, you might as well change it if a new last name might help you in some way. This may or may not be a continuation of the way names were used before the Chinese came—we really don’t know—but ever since, Vietnamese people have tended to take on the last name of whoever was in power at the time. It was seen as a way to show loyalty, a notion which required the relatively frequent changing of names with the succession of rulers. After all, you wouldn’t want to be sporting the last name of the previous emperor.

“This tradition of showing loyalty to a leader by taking the family name is probably the origin of why there are so many Nguyens in Vietnam,” says O’Harrow. Guess what the last ruling family in Vietnam was? Yep, the Nguyễn Dynasty, which ruled from 1802 to 1945. It’s likely that there were plenty of people with the last name Nguyen before then, as there were never all that many last names in Vietnam to begin with, but that percentage surely shot up during the dynasty’s reign.

Different Dialects

This is a flippant, silly video (with some language that you might not want young kids hearing), but it shows that the speakers of the same language can still has some have some significant barriers to understanding each other.  Dialects of a same language have different pronunciations but also distinct vocabulary that is often place-specific.  Dialects and accents create variety in cultural geography that makes traveling around the world enticing and exhilarating because there is always something else to learn about this crazy Earth.

GeoEd Tags: language, Australia, Oceania, video.

Using the National Atlas of Korea in the APHG classroom

Global fertility rates have been steadily dropping since 1960 and South Korea is probably the best example to use to discuss the rapid shifts in this trend (Bloomberg article “The Global Fertility Crisis” and NY Times article “End of Babies” are a good global overview that came out recently).  Above is the 2019 NCGE presentation that shows how to use the National Atlas of Korea in the APHG classroom using population as the prime case study (here are the powerpoint, slideshare, and PDF version).  Below is a post previously published here with supplemental resources on this exact topic for greater context.

South Korea is the world’s first country to have a total fertility rate below 1 (in 2019, it dropped to 0.98). It may not be the largest population of the 86 declining populations (114 countries have TFRs above replacement level), but it makes for an incredibly important case-study to explore emerging demographic patterns because in the coming years, it probably won’t be the only country with a TFR below 1.

Korea Pyramid
Population pyramid from the National Atlas of Korea

South Korean governments at multiple levels have implemented some pro-natalist policies (tax-benefits, cash incentives, maternity leave, paternity leave, etc.), and the TFR continues to drop. The economic reasons for this demographic decline make it a textbook example of a highly-developed economy where raising children is very expensive in a post-industrial, overwhelmingly urban context. However, I think more time should be spend investigating the cultural patterns that led more and more young adults to either postpone child-rearing or skip it all together. In South Korea, as in other countries, marriages are becoming more infrequent, but the social stigma associated with raising a child out of wedlock remains very strong (only 2% of births are to unwedded mothers). Many women returning to the workforce find that child-care options are limited they struggle to find the same wages that they had before they started a family. Even before without children though, women in South Korea are confronted with the highest gender wage gap among OECD countries. As reported in the WSJ, “South Korea has a strong economy, fast internet—and a big gender gap.” Korean work culture expects long hours, after hours social gatherings, and other practices that make it difficult to workers, but especially women, to find a manageable balance between having a career and a family. Many corporations are reluctant to hire/promote/mentor women that might conceivably conceive and leave the company.

Korea Fert
South Korea’s declining fertility rates (source).

Today, many Korean families see having no children as the only way to survive/improve their quality on life given the economic and cultural context within which they are operating. The government has been pouring millions of dollars to reverse this pattern but the fertility rate continues to drop. The video below gives an introduction to the issue.

This video provides a more in-depth look into the issue (turn on the closed captioning)

GeoEd Tags: South Korea, declining population, population, gender, labor.

Good resources to understand South Korea’s Declining population:
National Atlas of Korea: Population Projections.
QZ: South Korea’s birth rate just crashed to a new alarming low
CityLab: South Korea is trying to boost its birth rate. It’s not working.

A slightly larger than average South Korean family


Economies of South America

“Data from IMF, World Economic Outlook, April 2019

There are many stories in this video in the nearly 40 years of economic history of South America since 1990.The two most important stories portrayed (or at least the most dramatic) in the animated chart are decline of Venezuela’s economy and the rise of Chile’s.  This video can act as a primer to get students to consider the regional context of economic growth as well as the differing historical, political, and geographic context that leads to distinct results in any given country.

GeoEd Tags: South America, Latin America, economic, historical, political, video.

Masters of Tradition: A Cultural Journey Across America

NEA Map

Explore the Masters of Tradition story map. Discover the rich diversity of cultures and artistic traditions that enliven our nation. Meet extraordinary artists from across the country who have been awarded the National Endowment for the Arts National Heritage Fellowship, the nation’s highest honor for excellence in the folk and traditional arts. Together they represent a remarkable portrait of America’s diverse cultural heritage.” SOURCE: ESRI

This is an excellent StoryMap that to shows examples of local and indigenous cultures that are being practiced by some in the United States.  The NEA Fellowship also shows how preserving local and indigenous cultural traits in the face of popular cultural influences is difficult and is seen as a national priority and part of a treasured cultural heritage.  This is a good article on how to plan a good storymap.

Excellent Examples using the Map Tour template:

  1. Ancient Worlds of the World
  2. New Wonders of the World
  3. Visit Palm Springs
  4. A Gallery of other examples

GeoEd Tags: indigenous, culture, esri, storymap.


Create a free website or blog at WordPress.com.

Up ↑