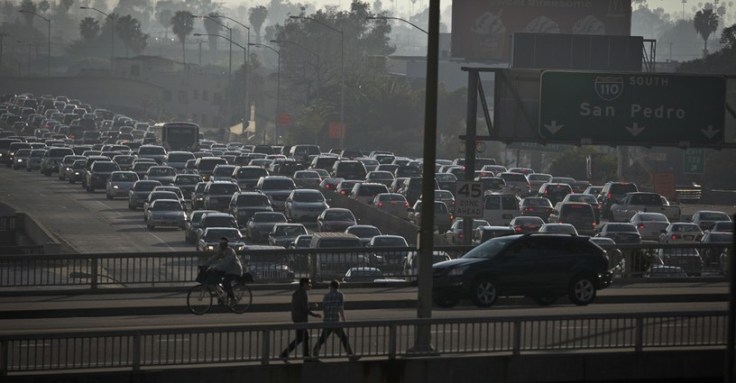
Search

GEOGRAPHY EDUCATION

Supporting geography educators everywhere with current digital resources.

Five Tips and Strategies on How to Interpret a Satellite Image

What do you do when presented with a new satellite image? Here’s what the Earth Observatory team does to understand the view.

  1. Look for a scale
  2. Look for patterns, shapes, and textures
  3. Define the colors (including shadows)
  4. Find north
  5. Consider your prior knowledge

Question #2: READ TO ANSWER FOR MORE INFO ON THE FIVE TIPS: earthobservatory.nasa.gov

Question #3: Also search through NASA’s Earth Observatory (Images or Articles) and the Jefferson Grid Instagram account.

Aerial photography can be quite beautiful, as can satellite imagery. These are more than just pretty pictures; interpreting aerial photography and satellite imagery is not easy; here is a great article that gives an introduction on how to interpret satellite imagery. With a little training, satellite images become rich data sources (instead of some visually meaningless data).  Using Stratocam, you can explore and tag some of the amazing place on Earth. 

Tags: mapping, perspective, remote sensing, geospatial, unit 1 Geoprinciples.

See the Strange, Beautiful Landscapes Revealed by Lasers

“Geospatial technologies unearth a world hidden beneath the lush forests of the Pacific Northwest.”


If you were to strip a forest of all its vegetation, what would you see? To find out, Washington state’s government is using airplanes equipped with LIDAR technology to scan the state’s heavily-forested ground. What’s being revealed beneath the trees is a spectacular and strange landscape of hidden geology. Old landslides, abandoned river channels, ancient lava flows, and the tracks of glaciers are suddenly visible in stark relief. Tracking the altitude and location of a plane with GPS while it scans the ground with LIDAR yields a highly precise digital elevation map of the Earth’s surface created out of the billions of laser pulses. By uncovering the debris from old landslides, LIDAR can show where future slides may occur.


Tags: geomorphologyremote sensing, geology, physical.

Source: news.nationalgeographic.com

Houston’s stories of Hurricane Harvey

“Blue and her team selected 45 stories, each plotted with ESRI’s ArcGIS software on a map of Greater Houston and tied to the exact location where it was first told. The resulting story map of Hurricane Harvey, ‘Damaged and Defiant: Houston Stories,’ was published in the Houston Chronicle in December. The map shows short narratives gathered by Chronicle staffers from people across the area — from Crosby to Kingwood to Katy — each a unique perspective on the storm; told together, they’re the collective account of a city that experienced one of the worst natural disasters in U.S. history.”

Source: news.rice.edu

These interlinked Houston story maps show some of the key elements of a good story map: 1) strong spatial analytical components, 2) a powerful narrative, 3) rich visuals, 4) solid cartography, and 5) well-sourced information.


Tags: fluvialwatercoastal, urban, disasters, physical, mappingESRIStoryMap.

The Geography of AC

“The modern built environment in the United States is now totally dependent on air conditioning. A lot of our buildings would be uninhabitable in the summer without AC, and all of the electricity needed to keep it running.”

Source: 99percentinvisible.org

Like so many 99 percent invisible podcasts, this blends urban design, social geography, local history in a way that deepens our understanding of place. Air conditioning has powerfully reshaped so many geographic patterns that many of ways.  Some mentioned in this podcast include: a) the rapid expansion of the Sun Belt, b) less climatically and regionally distinctive architecture can now be found in the cultural landscape, and c) an enormous amount of energy is consumed to maintain our hyper-cooled buildings (the U.S. now uses as much electricity for air conditioning as it did for all purposes in 1955). 


Tagspodcast, architecturehousing, landscape, place planning.

The art of making globes

“In the era of Google Maps, who makes a living out of creating globes – by hand? Peter Bellerby, of Bellerby & Co. Globemakers, for one. Headquartered in London, he talks with Martha Teichner about how a desire to purchase a globe led to him becoming one of the masters of the craft.”

Source: www.youtube.com

Yes, these globes are precise archives filled with geospatial data and locational information–however, that pales in comparison to the artistic brilliance of the globes. These hand-crafted globes are truly works of art.  Marvel at the merger of mathematical precision and artistic design that makes a globe such as these a cartographic gem. 

FUTURE WATCHING: Here is the longer video of the Bellerby Globes being produced.     


Tags: cartography, visualization, mapping, artgeo-inspiration.

National Geographic Reckons With Its Past: ‘For Decades, Our Coverage Was Racist’

“Before it could publish an issue on race, the magazine first had to look at its own history. ‘Some of what you find in our archives leaves you speechless,’ writes editor Susan Goldberg.  The 1916 caption of the picture of these aboriginal Australians described them as ‘savages who rank lowest in intelligence of all human beings.'”

Source: www.npr.org

This is both incredibly obvious, and remarkably shocking.  I don’t think that any academic geographic should be surprised that for generations, National Geographic’s goals to describe the world’s people and it mission to sell magazines made its coverage a product of the cultural norms of the times, the magazine producers and subscribers.  Still, this open honesty coming from National Geographic about National Geographic’s past is a breath of fresh air that is quite encouraging, even if some still think that National Geographic’s issue and cover miss the mark.

Questions to Ponder: Are there some voyeuristic tendencies we might exhibit as well learn about, or discuss other cultures?  How do we highlight culture differences without making making those with different cultural practices seem as innately ‘other’ or ‘less than?’    

Tags: National Geographic, race, racismmedia

Income and Wealth Inequality

Inequality is a big, big subject. There’s racial inequality, gender inequality, and lots and lots of other kinds of inequality. This is Econ, so we’re going to talk about wealth inequality and income inequality. There’s no question that economic inequality is real. But there is disagreement as to whether income inequality is a problem, and what can or should be done about it.

Source: www.youtube.com

There are many of the 35 videos in the Economics crash course set that touch on geographic issues.   This crash course team explains the difference between wealthy inequality and income inequality.  This video also has a nice laymen’s explanation of the GINI coefficient and how it measures inequality.   In another video in the series, they demonstrate how globalization can be seen as the path to economic growth and others see the process of globalization as what has created poverty


Tagsdevelopment, laborglobalization, economicindustry, poverty, crash course

How Dollar General Is Transforming Rural America

“Dollar General stores thrive in low-income rural towns, and the deep-discount chain has opened hundreds of new shops in the past year.”


Dollar General is set to open 1,000 locations this year, for a total of more than 14,000 stores. It will have more stores than McDonald’s has restaurants in the entire country. That includes plenty of urban locations, but the chain’s bright yellow and black signs pop up about every 10 miles along many remote state highways. Like Walmart, it has rural roots. Dollar General started in small-town Kentucky. Al Cross, who runs the Institute for Rural Journalism at the University of Kentucky, says Dollar General competes with the world’s largest retailer on price and convenience.


Tags: rural, retail, podcast.

Source: www.npr.org

Obesity: not just a rich-world problem

“Obesity is a global problem, but more people are getting fatter in developing countries than anywhere else. If current trends continue, obese children will soon outnumber those who are undernourished. Nearly half of the world’s overweight and obese children under five years old, live in Asia. And in Africa, the number of overweight children under five has increased by nearly 50% since 2000. Hunger still blights many parts of the world. But the share of people who do not have enough to eat is in decline. Globally one in nine people in the world suffer from chronic undernourishment. One in ten are obese. If current trends continue, the share of obese children in the world will surpass the number of undernourished by 2022. Africa has the fastest-growing middle class in the world. A move from traditional foods to high-calorie fast food and a more sedentary lifestyle is driving the rise in obesity. Health systems in Africa, more focused on treating malnourishment and diseases like malaria and HIV, are ill equipped to deal with obesity-related illnesses like heart disease and diabetes. “


Tagsmortality, medicaldevelopmentfood.

Source: www.youtube.com

Create a free website or blog at WordPress.com.

Up ↑