Italy’s a country that we may think of as monolithic, but (like so many other countries) it has some deep and persistent regional distinctions. These videos are older, but the the divisions discussed are still pertinent. Stratfor also added a video of Italy in their “Geographic Challenge” series. I’ve updated my map which spatially indexes 70+ of their videos that are especially relevant to geography teachers to include this one. These videos are great starting points for students that are researching a particular country.
“While the Korean War of the early 1950s never formally ended, its aftermath has created starkly divergent worlds for those living on either side of the north-south divide. What follows is a look at life in the two Koreas; how such a night-and-day difference came to be; and where the crisis could go from here. Both governments claimed to be the legitimate rulers of the peninsula. Tensions between north and south gradually mounted, until finally, in June 1950, hundreds of thousands of North Korean troops stormed across the 38th parallel. The unsuspecting South Korean defenders were outgunned and outnumbered, and beat a hasty retreat southward.”
This excellent interactive was created by Esri’s Story Maps team using the Story Map Cascade app–making it an great resources of the geography of the Korean Peninsula as well as a stellar example of how maps, infographics, videos, images and text can be combined using ArcGIS online.
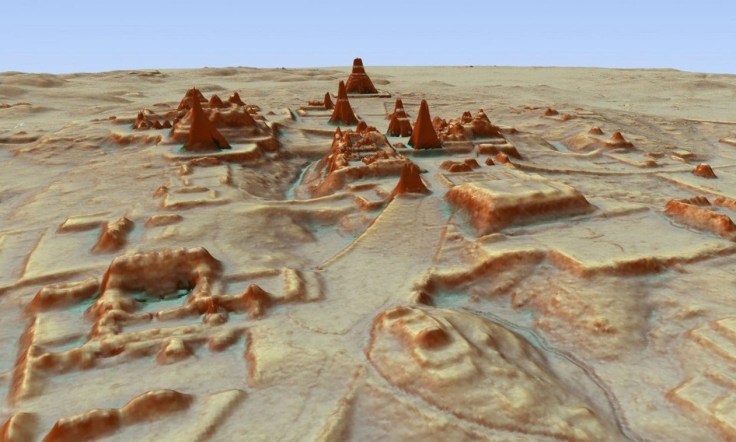
Scientists using high-tech, airplane-based lidar mapping tools have discovered tens of thousands of structures constructed by the Maya.
Archaeologists have spent more than a century traipsing through the Guatemalan jungle, Indiana Jones-style, searching through dense vegetation to learn what they could about the Maya civilization. Scientists using high-tech, airplane-based lidar mapping tools have discovered tens of thousands of structures constructed by the Maya: defense works, houses, buildings, industrial-size agricultural fields, even new pyramids.
The lidar system fires rapid laser pulses at surfaces and measures how long it takes that light to return to sophisticated measuring equipment. Doing that over and over again lets scientists create a topographical map of sorts. Months of computer modeling allowed the researchers to virtually strip away half a million acres of jungle that has grown over the ruins. What’s left is a surprisingly clear picture of how a 10th-century Maya would see the landscape.
“Play this interactive game–move the 15 red countries to their appropriate locations to turn the countries green. If you give up, you can double click on a red country to locate it (but it will turn blue).”
The old link to this map quiz no longer works but here is a new version. This online game where you return the “misplaced” country on the map is more than just and exercise in locating places (there are many online map quizzes for that sort of activity). What makes this one unique is that as you move the country further north or south the country expands or contracts according to how that country would be projected if that were its actual location on a Mercator map. This is a great way to introduce the importance of map projections.
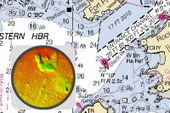
“The Story Map Swipe and Spyglass app template enables users to interact with two web maps or two layers of a single web map, depending on how you build your story. The app enables you to present a single view, or to develop a narrative showing a series of locations or views of the same maps.”
The ESRI template to create swipe and spyglass feature is an engaging way to compare and contrast two data layers. For the SPYGLASS maps, I’ve always enjoyed this historical interactive of Chicago. Chicago is displaced during a economic boom period as the U.S. was expanding westward. Where were the railroads located then? Why have some of them vanished today? Notice anything curious about the coastline along Lake Michigan? Follow this link to see similar interactives of other major U.S. cities.
Overpopulation doesn’t feel like a serious issue when you live in a land characterized by wide open spaces, but in some densely settled urban centers, the issues become quite personal. Hong Kong is currently facing a housing shortage. This article nicely explains the difficulties that living in the so-called coffin homes makes for the residents. This photo gallery humanizes this difficult living condition.
A fitness tracking app and national security don’t seem to be connected, and yet this month, the Pentagon has spent serious time discussing how to mitigate the impact Strava’s global data set being post online. Strava’s global heatmap (an absolute thing of beauty, trust me) has been used to highlight some fantastic spatial exercise patterns by helping users to visualize big data.
Strava Heatmap reveals Salt Lake County’s ski slopes
Running, cycling, and urban-planning-related media outlets all were excited in November 2017 about this amazingly data-driven, and yet artistically-rendered map. It wasn’t until a single tweet changed that paradigm:
Strava released their global heatmap. 13 trillion GPS points from their users (turning off data sharing is an option). https://t.co/hA6jcxfBQI … It looks very pretty, but not amazing for Op-Sec. US Bases are clearly identifiable and mappable pic.twitter.com/rBgGnOzasq
U.S. bases near Mosul, Iraq stand out on the heatmap. U.S. soldiers are more likely to use the social media fitness/mapping app than Iraqi nationals—that contrast makes the data that is not user-specific, still far more revealing than would make Pentagon officials pleased. The Strava CEO had to release a statement highlighting their commitment to user’s privacy, etc. etc. but the clearly this was an unintended consequence of the project. Personally, I’m a huge fan of the platform and post my data there (Social Media + Running + Mapping = My Wheelhouse), but like all things, it is not without some drawbacks and limitations. The NY Times video below gives a good summary of the situation, with like images for students to tangibly see what is going on:
Geospatial intelligence is a knife that cuts both ways. We must consider all the possible ramifications of what might happen as we repackage, render and display geographic information (read the full twitter thread for more maps that reveal military bases).
Questions to Ponder: What are three discernible patterns that you can identify by analyzing the Strava Heatmap? What does this particular case study show for cartographers and others interesting in creating spatial information? What does this say for regular people now fully immersed in the midst of a geospatial revolution?
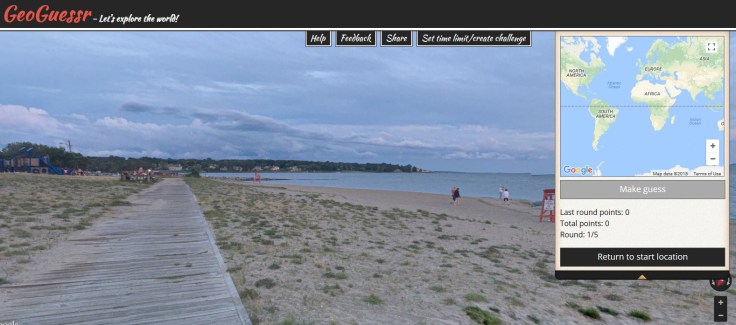
In May 2013, GeoGuessr came online and quickly became a favorite quiz game of geo-enthusiasts. Using 5 random locations in Google Street View. The game player can search the area in Street View and then make a guess as to where it is on the map. Using GeoSettr, you can create your own GeoGuessr challenge by choosing five locations on Google Street View.
You can customize your own GeoGuessr quizzes now, as others pan and zoom in the StreetView to explore the landscape you selected and find more context clues as to where that location is. Try my sample quiz that I made based on these 5 clues.
The best place to get clam cakes and doughboys in RI
My hometown is home to this center of athletic excellence
This monument was a part of my research in this Latin American city
This is where I went to school to get my Ph.D.
Home to the movie “Close Encounters,” this National Monument has always fascinated me.