Search

GEOGRAPHY EDUCATION

Supporting geography educators everywhere with current digital resources.

Tag

political

The unbearable sadness of being Taiwan, a liberal island other democracies refuse to talk to

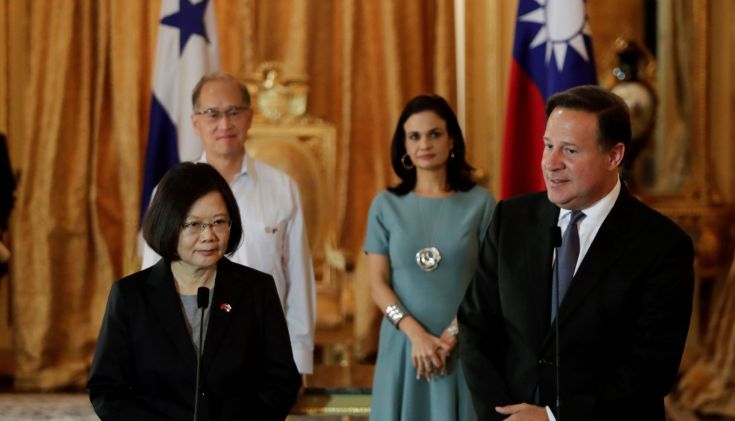
“An island, a territory, a self-governing entity, a renegade province, a breakaway part of China, the place formerly known as Formosa—call Taiwan any of those things, but never a country, a state, or a nation. The simple fact that it took a phone call between US president-elect Donald Trump and Taiwanese president Tsai Ing-wen to draw attention to one of Asia’s most vibrant democracies highlights the humiliating plight of Taiwan in the international arena. The irony that the US and other democratic countries cannot openly recognize Taiwan’s achievements for fear of incurring Beijing’s wrath has not been lost on many observers, who nevertheless fear that a cavalier move by Trump to upend diplomatic protocol in such a way could ultimately end badly for little Taiwan.”


Tags: Taiwan, political, states, borders, geopoliticsEast Asia.

Source: qz.com

Belgium and the Netherlands Swap Land, and Remain Friends

The discovery of a headless corpse in the Netherlands helped Belgium and its bigger Dutch neighbor resolve a property squabble that began in 1961.


In a region that has long known geopolitical and linguistic squabbles, and where Belgium has lived in the shadow of its neighbor, the land swap was anything but inevitable. In 1961, when the Meuse was reconfigured to aid navigation, it had the side effect of pushing three pieces of land onto the wrong side of the river. The uninhabited area subsequently gained a reputation for lawlessness, wild parties and prostitution.


Tags: borders, political, territoriality, BelgiumNetherlands, unit 4 political, Europe.

Source: www.nytimes.com

Labor unrest in Cameroon after clashes over language discrimination

In Cameroon, unrest in minority English-speaking regions over discrimination by majority French speakers is still simmering after violent clashes with police claimed at least four lives.


English-speakers have been protesting since Monday (11/21/2016) against what they see as their “second-class citizen status” and attempts to marginalize them in the west African nation. Eight of Cameroon’s ten regions are largely Francophone, but two regions, North West and South West Cameroon are English-speaking. English-speaking teachers complain that French-speaking counterparts are being increasingly deployed in English schools, despite differences in the curricula and teaching systems.


Tags: language, CameroonAfrica, culture.

Source: www.dw.com

Bamenda protests: Mass arrests in Cameroon

Some 100 people are arrested after protests against using French in Cameroon’s English-speaking region.


Areas controlled by Britain and France joined to form Cameroon after the colonial powers withdrew in the 1960s. The country has 10 semi-autonomous administrative regions – eight are Francophone and use the French civil law. English-speakers have long complained that they face discrimination. They often complain that they are excluded from top civil service jobs and that government documents are often only published in French, even though English is also an official language. Bamenda is the founding place of Cameroon’s largest opposition political party, the Social Democratic Front.


Tags: language, colonialism, CameroonAfrica, culturepolitical, devolution.

Source: www.bbc.com

Judges Find Wisconsin Redistricting Unfairly Favored Republicans

A federal panel called the 2011 redrawing of Wisconsin Assembly districts an unconstitutional gerrymander, ruling in a case that could go to the Supreme Court.

Source: www.nytimes.com

The redistricting process is far from neutral; to be fair we should remember that gerrymandering has happened on all ends of the political spectrum, depending on who is charge during the redistricting process (after the decennial census).  Which map to you think is the best way to divide these districts?  What is the fairest way to divide them?

Tags: gerrymandering, political, mapping, census, unit 4 political.

D.C. Votes Overwhelmingly To Become 51st State

District of Columbia voters passed the referendum Tuesday with nearly 80 percent in favor. Congress, which will ultimately decide the fate of the federal district, is not expected to approve it.


Voters in the District of Columbia passed a measure on Tuesday in favor of petitioning Congress to become a state in the union.

79 percent of voters cast votes in favor of the ballot measure, which splits the district into a residential state with a small federal district in the middle of it for government buildings and monuments, as we have reported.

The newly approved measure had four parts:

  1. agree that the District should be admitted to the Union as the State of New Columbia
  2. approve of a Constitution of the State of New Columbia to be adopted by the Council
  3. approve the State of New Columbia’s boundaries
  4. agree that the State of New Columbia shall guarantee an elected representative form of government.

Source: www.npr.org

Questions to Ponder: Why do the residents of the District of Columbia want to change the legal status of the District to a state?  Why might some states and politicians NOT want to see a 51st state?  What is needed in the United States to admit a new state (Puerto Rico is still a possibility to become the 51st state)?  


Tags: political, sovereignty, autonomy, Washington DC.

Election Cartograms

“The states are colored red or blue to indicate whether a majority of their voters voted for the Republican candidate, Donald Trump, or the Democratic candidate, Hillary Clinton, respectively. There is significantly more red on a traditional election maps than there is blue, but that is in some ways misleading: the election was much closer than you might think from the balance of colors, and in fact Clinton won slightly more votes than Trump overall. The explanation for this apparent paradox, as pointed out by many people, is that the map fails to take account of the population distribution. It fails to allow for the fact that the population of the red states is on average significantly lower than that of the blue ones.

We can correct for this by making use of a cartogram, a map in which the sizes of states are rescaled according to their population. That is, states are drawn with size proportional not to their acreage but to the number of their inhabitants, states with more people appearing larger than states with fewer, regardless of their actual area on the ground. On such a map, for example, the state of Rhode Island, with its 1.1 million inhabitants, would appear about twice the size of Wyoming, which has half a million, even though Wyoming has 60 times the acreage of Rhode Island.”


Tags: electoral, scale, politicaldensity, mapping.

Source: www-personal.umich.edu

US election 2016: Trump victory in maps

The map above shows where Mr Trump improved on the share of the vote achieved by Mitt Romney, the Republican presidential candidate who failed to beat President Barack Obama in 2012.


Tags: electoral, political.

Source: www.bbc.com

Maps to change how you think about American voters — especially small-town, heartland white voters

Small towns are as Democratic as big cities. Suburban and rural voters are the Republicans.


I have assembled a Web map from precinct-level 2008 election data that allows users to zoom in and out, focus in on specific towns or neighborhoods and superimpose census data on income and race, allowing readers to examine their own favorite postindustrial towns. One of the most striking lessons from exploring these maps is that the red non-metropolitan counties on election-night maps are internally heterogeneous, but always following the same spatial pattern: Democrats are clustered in town centers, along Main Street, and near the courthouses schools, and municipal buildings where workers are often unionized. They live along the old railroad tracks from the 19th century and in the apartment buildings and small houses in proximity to the mills and factories where workers were unionized in an earlier era.

Source: www.washingtonpost.com

There have been SOOOO many articles about the 2016 election, what happened, why it happened and how particular demographics voted and why.  Most of these articles are highly partisan, or ideologically informed but this just analysis of past spatial voting patterns  (I am waiting for the updated version of these maps to show what happened in 2016–but I’m thinking some of this changed).  Too often we’ve lumped the geography of small towns and rural areas as though they are one and the same.  Too often will only see electoral maps with state-level voting data or possibly county level data; but the sub-county scale reveals what would otherwise be missing in our assessment of electoral, spatial patterns (Scale matters?  Who knew?)


Tags: electoral, scale, political, mapping.

Create a free website or blog at WordPress.com.

Up ↑