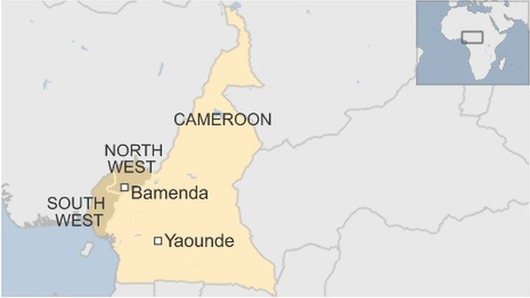
Search

GEOGRAPHY EDUCATION

Supporting geography educators everywhere with current digital resources.

Tag

political

Bamenda protests: Mass arrests in Cameroon

Some 100 people are arrested after protests against using French in Cameroon’s English-speaking region.


Areas controlled by Britain and France joined to form Cameroon after the colonial powers withdrew in the 1960s. The country has 10 semi-autonomous administrative regions – eight are Francophone and use the French civil law. English-speakers have long complained that they face discrimination. They often complain that they are excluded from top civil service jobs and that government documents are often only published in French, even though English is also an official language. Bamenda is the founding place of Cameroon’s largest opposition political party, the Social Democratic Front.


Tags: language, colonialism, CameroonAfrica, culturepolitical, devolution.

Source: www.bbc.com

Judges Find Wisconsin Redistricting Unfairly Favored Republicans

A federal panel called the 2011 redrawing of Wisconsin Assembly districts an unconstitutional gerrymander, ruling in a case that could go to the Supreme Court.

Source: www.nytimes.com

The redistricting process is far from neutral; to be fair we should remember that gerrymandering has happened on all ends of the political spectrum, depending on who is charge during the redistricting process (after the decennial census).  Which map to you think is the best way to divide these districts?  What is the fairest way to divide them?

Tags: gerrymandering, political, mapping, census, unit 4 political.

D.C. Votes Overwhelmingly To Become 51st State

District of Columbia voters passed the referendum Tuesday with nearly 80 percent in favor. Congress, which will ultimately decide the fate of the federal district, is not expected to approve it.


Voters in the District of Columbia passed a measure on Tuesday in favor of petitioning Congress to become a state in the union.

79 percent of voters cast votes in favor of the ballot measure, which splits the district into a residential state with a small federal district in the middle of it for government buildings and monuments, as we have reported.

The newly approved measure had four parts:

  1. agree that the District should be admitted to the Union as the State of New Columbia
  2. approve of a Constitution of the State of New Columbia to be adopted by the Council
  3. approve the State of New Columbia’s boundaries
  4. agree that the State of New Columbia shall guarantee an elected representative form of government.

Source: www.npr.org

Questions to Ponder: Why do the residents of the District of Columbia want to change the legal status of the District to a state?  Why might some states and politicians NOT want to see a 51st state?  What is needed in the United States to admit a new state (Puerto Rico is still a possibility to become the 51st state)?  


Tags: political, sovereignty, autonomy, Washington DC.

Election Cartograms

“The states are colored red or blue to indicate whether a majority of their voters voted for the Republican candidate, Donald Trump, or the Democratic candidate, Hillary Clinton, respectively. There is significantly more red on a traditional election maps than there is blue, but that is in some ways misleading: the election was much closer than you might think from the balance of colors, and in fact Clinton won slightly more votes than Trump overall. The explanation for this apparent paradox, as pointed out by many people, is that the map fails to take account of the population distribution. It fails to allow for the fact that the population of the red states is on average significantly lower than that of the blue ones.

We can correct for this by making use of a cartogram, a map in which the sizes of states are rescaled according to their population. That is, states are drawn with size proportional not to their acreage but to the number of their inhabitants, states with more people appearing larger than states with fewer, regardless of their actual area on the ground. On such a map, for example, the state of Rhode Island, with its 1.1 million inhabitants, would appear about twice the size of Wyoming, which has half a million, even though Wyoming has 60 times the acreage of Rhode Island.”


Tags: electoral, scale, politicaldensity, mapping.

Source: www-personal.umich.edu

US election 2016: Trump victory in maps

The map above shows where Mr Trump improved on the share of the vote achieved by Mitt Romney, the Republican presidential candidate who failed to beat President Barack Obama in 2012.


Tags: electoral, political.

Source: www.bbc.com

Maps to change how you think about American voters — especially small-town, heartland white voters

Small towns are as Democratic as big cities. Suburban and rural voters are the Republicans.


I have assembled a Web map from precinct-level 2008 election data that allows users to zoom in and out, focus in on specific towns or neighborhoods and superimpose census data on income and race, allowing readers to examine their own favorite postindustrial towns. One of the most striking lessons from exploring these maps is that the red non-metropolitan counties on election-night maps are internally heterogeneous, but always following the same spatial pattern: Democrats are clustered in town centers, along Main Street, and near the courthouses schools, and municipal buildings where workers are often unionized. They live along the old railroad tracks from the 19th century and in the apartment buildings and small houses in proximity to the mills and factories where workers were unionized in an earlier era.

Source: www.washingtonpost.com

There have been SOOOO many articles about the 2016 election, what happened, why it happened and how particular demographics voted and why.  Most of these articles are highly partisan, or ideologically informed but this just analysis of past spatial voting patterns  (I am waiting for the updated version of these maps to show what happened in 2016–but I’m thinking some of this changed).  Too often we’ve lumped the geography of small towns and rural areas as though they are one and the same.  Too often will only see electoral maps with state-level voting data or possibly county level data; but the sub-county scale reveals what would otherwise be missing in our assessment of electoral, spatial patterns (Scale matters?  Who knew?)


Tags: electoral, scale, political, mapping.

ISIS and the U.S. Presidential Election

The United States is already taking some steps to roll back the Islamic State (ISIS) and restrict its resources and recruits, including airstrikes, armin

Source: www.youtube.com

This is a non-partisan post and a video that is fairly balanced; this video nicely lays out some of the cultural and political factors that the next president of the United States should consider when crafting foreign policy in the especially problematic Middle East.  


Tags: Syria, war, conflict, political, geopolitics, Iraq, devolution, terrorism, ISISMiddle East.

Election maps are telling you big lies about small things

In 2012, 160 counties cast about the same number of votes as the rest of the country. But, your run-of-the-mill election map won’t show you that.

Source: www.washingtonpost.com

This is nothing new to most visitors to this site, but every four years we have a wonderful teaching moment to show how population density can change our interpretation of a map and the meaning of the data embedded in that map.  I preparation for next week, this article for the Washington Post as well as this one from the New York Times should help get students be better prepared for the onslaught of maps that we know are right around the corner, to properly assess and contextualize the geographic content in these maps.     


Tags: electoral, political, mapping.

Why you’re probably wrong about levels of immigration in your country

In developed countries around the world, people think immigrant populations are much larger than they actually are.


Americans consistently mention immigration as one of the nation’s most pressing political concerns, and it has become a signature issue in the presidential campaign. But while many Americans consider immigration one of the biggest issues for the future president, surveys suggest that they also have little understanding of the scale of the problem. The United States wasn’t alone in this tendency to exaggerate.


Tags: migrationstatistics, political.

Source: www.weforum.org

Blog at WordPress.com.

Up ↑