Search

GEOGRAPHY EDUCATION

Supporting geography educators everywhere with current digital resources.

From Germany to Mexico: How America’s source of immigrants has changed over a century

Today’s volume of immigrants, in some ways, is a return to America’s past.

Seth Dixon‘s insight:

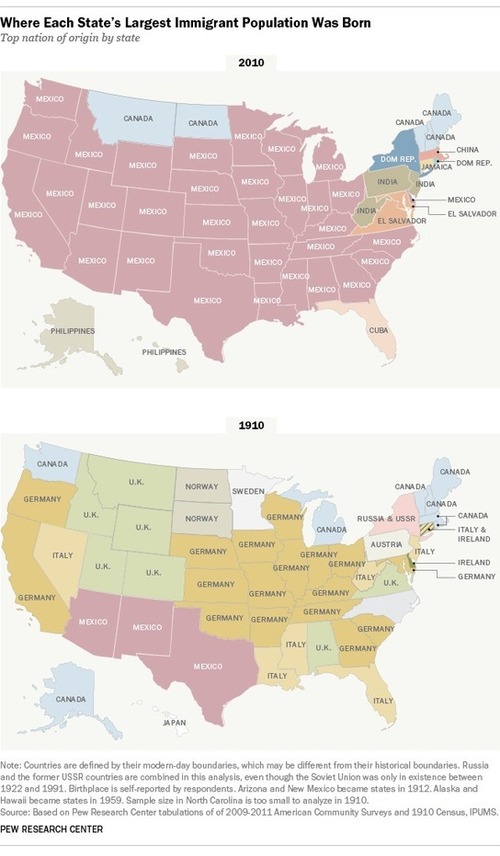
The source of migrants today has changed the cultural composition of the United States from what is was 100 years ago.  Cultures are not static and migration is one of the key drivers of change. These maps produced by the Pew Research Center. Despite what media reports would have you believe, immigration into the United States is not on the rise, but maps such as these can be construed to imagine that there is a flow of immigrant coming from south of the border.  The reality is that migration from Mexico to the United States has steadily dropped since 1999.  

Tags: migration, historical, USA, mappingcensus, ethnicity.

See on www.pewresearch.org

Argentina’s Falklands Banner Sparks Anger Ahead Of World Cup

Argentina and England are unlikely to meet at the World Cup finals, however their rivalry was reignited at the weekend when the Argentine national side posed behind a banner claiming the Falkland Islands belong to the South American country. Ahead of their warm-up match with Slovenia in Buenos Aires, the team displayed the message in support of the country’s claims over the sovereignty of the islands in the South Atlantic, which are a British Overseas Territory.


Seth Dixon‘s insight:

The World Cup can make things interesting when nationalistic fervor becomes politicized and moves to issues off the pitch.  Are they the Falklands or Las Malvinas?  It’s not just a simple linguistic translation but also a statement of territoriality and geopolitical recognition.  Like Gibraltar, the Falklands are British Oversees Territories, ones that Margaret Thatcher was willing to fight Agrentina to maintain;  Argentina still claims Las Malvinas as their territory.  For a great teaching resource on this issue, see the second slideshow in this series of  AP Human Geography talks that was given at NCGE 2013 (sign up to attend NCGE 2014 here).  


Tags: Argentinasport, bordersgeopolitics, political, territoriality, sovereignty.

See on www.huffingtonpost.co.uk

40 maps that explain food in America

“The future of the nations will depend on the manner of how they feed themselves, wrote the French epicurean Jean Anthelme Brillat-Savarin in 1826. Almost 200 years later, how nations feed themselves has gotten a lot more complicated. That’s particularly true in the US, where food insecurity coexists with an obesity crisis, where fast food is everywhere and farmer’s markets are spreading, where foodies have never had more power and McDonald’s has never had more locations, and where the possibility of a barbecue-based civil war is always near. So here are 40 maps, charts, and graphs that show where our food comes from and how we eat it, with some drinking thrown in for good measure.”

Seth Dixon‘s insight:

Occasionally these lists that say something like “40 maps that…” end up being an odd assortment of trivia that is interesting but not very instructive.  Not so with this list that has carefully curated these maps and graphs in a sequential order that will enrich students’ understanding of food production and consumption in the United States.

Tags: agriculture, food production, food distribution, locavore, agribusiness, USA

See on www.vox.com

Solar Roadways


See on Scoop.itGeography Education

Seth Dixon‘s insight:

I’m sure a few of you have already seen this viral video and it should be intriguing to geographers for a variety of reasons (and not just because we love hexagons). Solar Roadways is a project in its infancy, but they have broad ambitions that would be revolutionary.  Roads that would produce energy?  The idea would have staggering results, but there are some practical reasons why this hasn’t already been implemented.  A geographic perspective is critical as we plan for the future.   

Questions to Ponder: How would the full implementation of this idea restructure the cultural landscape, urban environments and our cultural ecology?  What would some advantages be?  This video is a promotional video that emphasizes the positive; what drawbacks, limitations and obstacles are there to solar roadways in the future?  

Tags: transportation, technologyenergysustainability, planning, video.

See on www.youtube.com


APHG Reader Suggestions

See on Scoop.itGeography Education

Seth Dixon‘s insight:

I’ve had a wonderful week in Cincinnati at the APHG reading.  Teachers love to share ideas and resources when we gather together and we’ve compiled 4 pages of links, books, websites and other resources that APHG readers have suggested for classroom use.  Here is a 4-page compilation of APHG reader-suggested resources. Additionally, here is the final newsletter (earlier editions of the newsletter archived here).   I’ll miss the friendliness and professional expertise of this fantastic network of geography educators.  See you next year!

12 Data visualizations that illustrate poverty’s biggest challenges

See on Scoop.itGeography Education

Want to learn more about the issues surrounding poverty in the world today? We ve assembled a collection of some of the best data visualizations for just that.

Seth Dixon‘s insight:

This set of 12 graphics all show a particular facet on the topic of global poverty.  I’ve shared some of this before, but the compilation is definitely helpful.  In the graphic above, the connection between low female literacy rates and poverty is demonstrated quite powerfully.    


Tags: poverty, development, economic, visualization.

See on www.one.org

Portraits of people living on a dollar a day

See on Scoop.itGeography Education

“More than a billion people around the world subsist on a dollar a day, or less. The reasons differ but the day-to-day hardship of their lives are very similar. A book by Thomas A Nazario, founder of the International Organisation, documents the circumstances of those living in extreme poverty across the globe, accompanied by photographs from Pulitzer prizewinner Renée C Byer. Living On A Dollar a Day is published by Quantuck Lane.”

Seth Dixon‘s insight:

Extreme poverty is defined by the World Bank living on under $1.25 per day.  The geography of of extreme poverty highly uneven–two thirds of the extremely poor live in just 5 countries (India, China, Nigeria, Bangladesh and DR Congo).  This photogallery seeks to to show the daily life and realities of those living in extreme poverty.  This article from the Guardian argues that development should measured in human rights gains more than economic advancements. 

Tags: poverty, images, development, economic, perspective.

See on www.theguardian.com

The U.S. Cities That Sprawled the Most (and Least) Between 2000 and 2010

See on Scoop.itGeography Education

Two maps and six charts take sprawl rankings to another level.

Seth Dixon‘s insight:

One of the great results of the decennial census is that geographers, demographers, sociologists, urbanists and countless others, can track the same population or spatial pattern and note historical changes over a 10 year span.  This series of maps and charts highlights some of the major changes.  You shouldn’t be surprised that Atlanta is the United States’ most sprawling major city and that San Francisco is the most compact, but this article dives beneath surface in a way that is still very accessible.   


Tagsurban, unit 7 cities, housing, sprawlneighborhoodplanning, densityplanning

See on www.citylab.com

Changes on the Cape Cod Coastline

See on Scoop.itGeography Education

Beaches are dynamic, living landscapes. The coast off of Chatham, Massachusetts, provides a prime example of beach evolution.

Seth Dixon‘s insight:

To quote coastal geologist Robert Oldale, “Many people view coastal erosion as a problem that needs to be addressed and, if possible, prevented.  However, storm and wave erosion along the shore of Cape Cod has been going on for thousands of years and will likely continue for thousands of years more. It is a natural process that allows the Cape to adjust to rising sea level. Erosion is only a peril to property. If we build on the shore, we must accept the fact that sooner or later coastal erosion will take the property away.”

Tagscoastal, remote sensing, mappingerosion, landscape.

See on earthobservatory.nasa.gov

Blog at WordPress.com.

Up ↑